About
Learn why and how this website was created.
Expand a section to learn more …
Why make this site ?
This site was created for the following reasons:
- Raise awareness about PCBs in schools by showcasing how Vermont’s first-in-the-nation PCB monitoring and abatement program can make schools healthier places for students and teachers
- Create explorable and accurate information that can be used by parents, schools, government, the press and legislature
- Advocate for the continued funding of this program and provide a glimpse of the potential national scale of the problem
- Raise more questions and ideas
How was this project funded and how might I help ?
This project was self funded but those personal funds are very limited. There is still much to do, like starting school PCB monitoring and abatement programs in other states, networking with stakeholders like schools and legislature, and more research, analysis and visualization. Please contact me if you want to help me continue this work, collaborate, or if you have any knowledge about similar work going on in other cities, states or countries, I’d love to hear from you. Thanks!
Data origin and download
The raw public source data behind this work has been very kindly shared by the Vermont Department of Environmental Conservation (VTDEC). It comes in the form of a single comma-separated values (CSV) file that contains approximately 14,000 rows and 114 columns. I prepare and transform this data into more data and information used for building the Tableau dashboards embedded in the site.
Please contact me directly to request a copy of the original source data used to build this site. For the latest version of this public data, please contact the VTDEC directly.
Data preparation and transformation
This section describes how the raw source data is prepared and transformed into assets that are then used in visualization using Tableau Public. Field names – i.e. data source columns – are italicized. A general processing overview is show below.
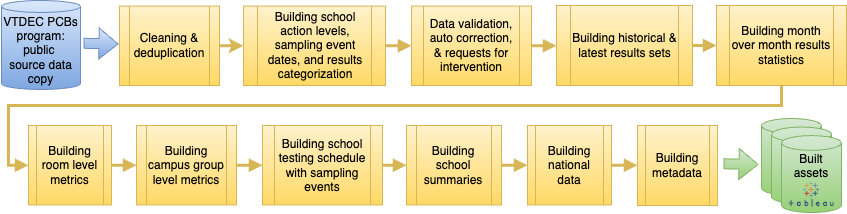
Various aspects of this process are covered below in more detail. Contact me if you have a question about something not covered here.
Ambient samples and field blanks
Ambient samples are air samples taken outside of the school building as a representative ambient sample. Field blanks are used to detect any contamination introduced during transport, setup or laboratory analysis. Data rows containing ambient samples or field blanks don’t correspond to actual air samples taken in rooms and are removed based on the case insensitive and logically OR’d rules in the table below. Removed rows are stored in a separate file for checking and QA.
| Measurement type | Field name | Regular expression match |
| Ambient | Room | ambient|amb|exterior |
| Ambient | OccupancyType | ambient |
| Ambient | ConsultantSampleID | [-_ ]amb|ambient |
| Field blank | Room | \b(fb|field blank|blank)\b |
| Field blank | OccupancyType | \b(fb|field blank)\b |
| Field blank | Matrix | \b(fb|blank)\b |
| Field blank | AnalysisLocation | FB |
| Field blank | ConsultantSampleID | ([- _]fb|field blank |
| Field blank | SampleTypeCode | FB |
Room value standardization
The case of the same Room name can vary across measurements e.g. ‘Room A’, ‘room A’ and ‘Room a’ are all the same room. Room names are first processed by removing leading and trailing whitespace. They are then standardized by ‘capitalization’, which in this example converts all names to ‘Room A’.
CampusGroup value standardization
The case of the same CampusGroup name can also vary across measurements e.g. ‘Classroom Area 1’ and ‘Classroom area 1’ are the same campus group. CampusGroup names are first processed by converting to strings and removing leading and trailing whitespace. They are then standardized by ‘capitalization’, which in this example results in ‘Classroom area 1’.
Blank analyzed Result values
Samples are considered analyzed if an AnalysisDate is set. Blank Result values for analyzed samples are converted to 0 (zero).
School action levels (SALs)
School action levels (SALs) are calculated using the youngest grade of occupancy at each school. The first regular expression match against the set of unique and lowercase YoungestGradeOfOccupants values for all rooms sampled at each school is used to determine each SAL. Room samples containing blank YoungestGradeOfOccupants values require manual correction to the source data before more processing can occur.
| Regular expression match | Grade deduction | SAL |
| pre-kindergarten | Pre kindergarten | 30 |
| (^k|^\s*[1-6]\s*($|st|nd|rd|th)) | K-6 | 60 |
| Anything else | 7-12, Adult, Staff | 100 |
Result binning
Result values for test samples are binned into 4 categories based on the SAL as follows, with the first match being used:
| Result value | Result bin |
| >= 3 * SAL | PCBs detected at or above IAL |
| >= SAL | PCBs detected at or above SAL |
| > 0 | PCBs detected |
| 0 | No PCBs detected |
Calculating sampling event start dates
Sampling of a school is done over a ‘sampling event’ which can span multiple days. Sampling event start dates are used for data cleaning (eg row deduplication), data analysis and visualization purposes. They are calculated for each school based on a 5 day threshold applied to SampleDate values.
Duplicate row removal (‘deduping’)
Duplicate PCB air samples are taken by environmental consultants for field sampling quality control. Duplicate samples are automatically detected by locating repeating sets of {SchoolBuildingName, sampling_event_start_date, Room} values. The member with the highest Result value is chosen and a summary of removed and selected duplicates is stored in a separate file for checking and QA.
Miscellaneous checks
The following miscellaneous checks are described below together with their respective actions. Rows with detected issues are saved to a separate file for checking or guided manual correction.
| Check | Action taken |
| Rows which have DetectFlag = N but Result has a value | Result automatically set to 0.0 |
| Rows which have RoomSampled = No but Result has a value | RoomSampled automatically set to Yes |
| Rows which have SampleDate > AnalysisDate | AnalysisDate automatically set to SampleDate |
| Damaged rows : these are rows where RoomSampled = Yes, but the data was damaged and missing. These rows are determined by testing also for Unit and DetectFlag being blank | RoomSampled set to No |
| Blank Room value | Review/correct manually |
| Room value containing ‘dup’ (case insensitively) | Review/correct manually |
| Unit not ‘ng/m3’ | Review/correct manually |
| RoomSampled = TRUE and OccupancyDesignation is blank | Review/correct manually |
| Lowercase SamplePurpose values are not one of: (blank), ‘initial sampling’, ‘quarterly sampling’, ‘quarterly monitoring’, ‘mitigation sampling’ or ‘mitigation monitoring’ | Review/correct manually |
| Room values contain more than 1 contiguous spaces | Review/correct manually |
Validating SamplePurpose values
The purpose of each sample is denoted in SamplePurpose. This data is later used to determine and visualize what the effect of PCB mitigation has been. If a blank SamplePurpose is detected in the first sampling event of a sampled room, it is automatically set to ‘Initial sampling’. Any blank SamplePurpose values in subsequent (non-initial) sampled rooms in sampling events are flagged as errors that require manual correction. If a room was sampled at more than one sampling event, the SamplePurpose may change. The following invalid transitions of SamplePurpose are tested for (ignoring case):
| Invalid SamplePurpose transition | Reasoning |
| Mitigation sampling or monitoring transitioned to quarterly or initial sampling or monitoring | Once mitigation has occurred, mitigation sampling does not switch back to quarterly or initial sampling or monitoring |
| Initial sampling transitioned to initial sampling | Initial sampling can only occur once and at the first sampling event |
Building ‘latest’ results
Latest sampling results based on sampling event start dates are gathered for each school room. If a room was sampled at only one sampling event, the result from that sampling event will be used. If a room was sampling at more than one sampling event, the most recent result will be used.
For rooms sampled at multiple sampling events, if the most recent SamplePurpose indicates that action was taken to mitigate PCBs (i.e. ignoring case, SamplePurpose begins with ‘mitigation’ ) then a ‘PCB mitigation score’ is calculated based on a comparison between the first sampling event Result and the latest Result. Scores are calculated based on both primary and ancillary OccupancyDesignation values.
| Room PCB Mitigation Score | Description |
| -2 | Either only one test has been done, or, mitigation or remediation action was not yet taken |
| -1 | Airborne PCBs increased more than 25% between the first test and most recent mitigation-based test |
| 0 | Airborne PCBs remained within +/-25% between the first test and the most recent mitigation-based test |
| 1 | Airborne PCBs decreased more than 25% between the first test and the most recent mitigation-based test |
Room-based statistics and metrics generation
Room-based statistics and metrics are generated for schools’ room samples that were analyzed at a lab. These are created for both ancillary and primary room occupancy types as follows:
- Highest all time sample result, the room and sampling event it was found at
- Highest latest sample result, the room and sampling event it was found at
- For rooms that were sampled during multiple sampling events, ‘change’ counts of the number of rooms where results increased/decreased/remained unchanged.
- Sampling event history showing how many rooms were tested during each sampling event
- PCBs mitigation ‘scores’ for each school are calculated: first the set of rooms which had a room mitigation score of -1, 0 or 1 is built. Using this set of rooms, the school score is calculated by multiplying the set’s average room mitigation score by the number of rooms in the set. A positive school score is used to indicate an overall decrease in PCBs, a negative score to indicate an overall increase in PCBs, and a zero score to indicate no change.
Campus group-based statistics and metrics generation
Result statistics (mean, median etc) that are independent of SamplePurpose values are created for each school campus group for each sampling event. Then, ‘Progress’ campus group statistics and metrics that are dependent on SamplePurpose values are created as follows:
- Room Result metrics (mean, median etc) are created for each sampling event using rooms where SamplePurpose indicated mitigation was done for each campus group in each school.
- Using metrics from the previous step, school-level ‘counts-and-scores’ summaries are created including:
- Counts of the number of campus groups for which each metric increased/decreased/remained unchanged
- A score for each metric, where -1/0/1 indicates the metric increased/decreased/remained unchanged
- Using metrics from the first step, campus group metric score summaries are calculated for each school, again where -1/0/1 indicates the metric increased/decreased/remained unchanged.
Tableau visualization and development environment
I chose to use Tableau Public for interactive visualizations of the prepared and transformed data. Interactive dashboards were first created with Tableau Public version 2024.3.0 and then embedded into the website. Coding was done in Python 3.11.5 in the PyCharm 2023.3.2 (Community Edition) IDE.
The author
My name is Dominic Nicholas and amongst other things I’m an independent data activist. Learn more about me at ![]() at
at ![]() , or contact me directly.
, or contact me directly.
Acknowledgements
This project would not have been possible without the VTDEC’s generosity of time and data. I would especially like to thank Eben Pendleton for his kindness, patience, time and willingness to continually improve the data – this project would not have been possible without you! THANK YOU.